Over the past 237 years, close to 13,000 U.S. senators and House members have participated in more than 113,000 roll calls and cast more than 26 million votes. While it’s difficult to imagine anyone wanting to torture themselves enough to dig through all of that, thanks to UCLA political science professor Jeff Lewis, you now can, at Voteview.com. The site allows users to view literally every congressional roll call vote in American history, on both a geographic map and an ideological map.
Conceived more than 35 years ago by political scientists Howard Rosenthal and Keith T. Poole at Carnegie Mellon University, Voteview limped along for decades, its tech growing increasingly outdated. Approaching retirement in 2016, Poole and Rosenthal handed the project over to Lewis, a former colleague.
For Lewis, inheriting Voteview meant bringing a long-neglected platform into the modern era. The site’s Windows-only desktop software was now obsolete and difficult to maintain. With institutional support from UCLA and a grant from the Hewlett Foundation, Lewis and his team spent roughly a year rebuilding the site from the ground up, transforming it into a web-based platform that now updates with every congressional vote.
The site, Lewis says, “These nominate scores have become a basic infrastructure in the study of American politics, so there’s a lot of demand for this to be continued.”
There sure is. The New York Times, The Washington Post and CNN are just a few of the media giants accessing Voteview regularly to inform their reporting. Academics, investment bankers, officeholders and plain old political junkies are well represented in the user pool, too.
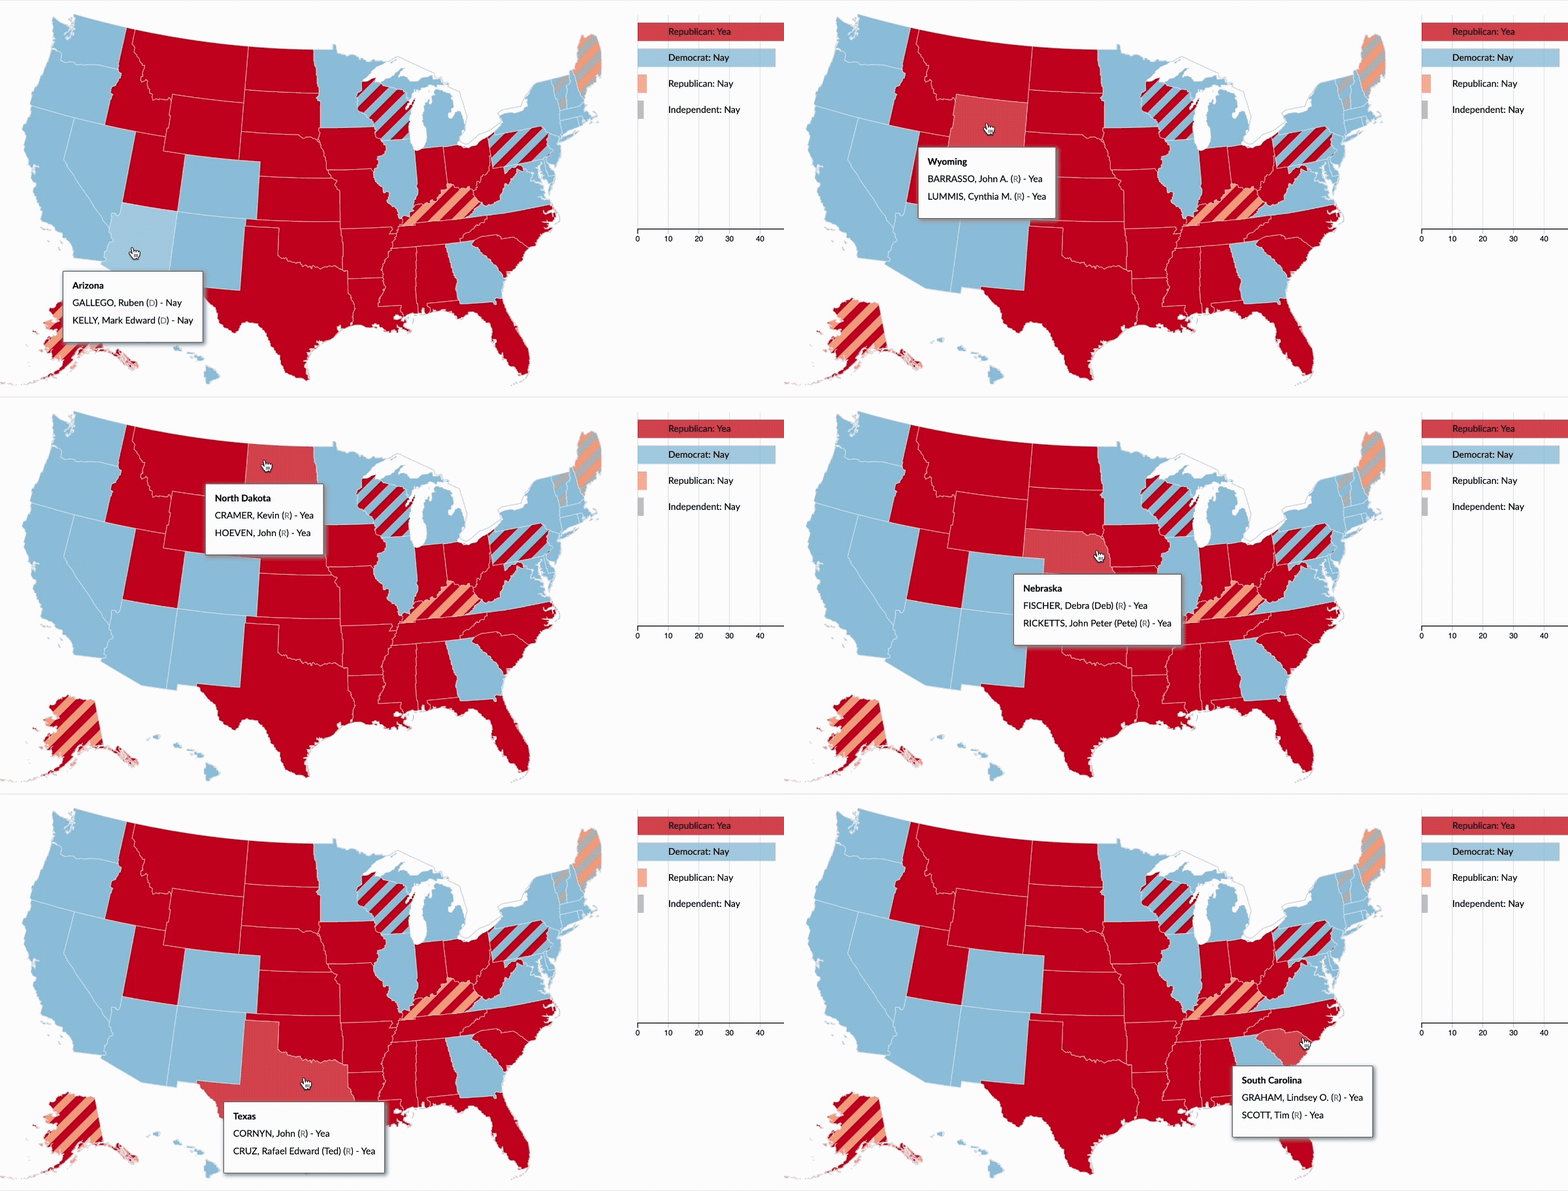
Visitors are also able to calculate “ideological scores” that place each legislator along the liberal-conservative spectrum, allowing comparisons across different time periods. There’s also “polarization” visualization, which shows how far apart Democrats and Republicans have moved over time. (It’s … far.)
Political campaigns interested in opposition research are also active users. “Sometimes campaign staffs will say, ‘Oh, Voteview says this guy was the most liberal or most conservative person in Congress,’” Lewis says. “‘What does that mean? And can I use that in a not-so-nice way in our campaign?’”
Roll call data were first collected around the time of the Great Depression via a Works Progress Administration project; beginning in the 1960s, the information was computerized. The deeper analysis that’s now a tentpole of the site, however, proved a bit more labor-intensive. Poole himself spent countless hours manually classifying voting topics and uploading them. “[Rosenthal and Poole] were actually using supercomputers to do the estimation,” Lewis says. “Now, you could probably do it on your phone.”
Since its relaunch in 2017, Voteview has relied heavily on AI and machine learning, along with some student assistance, with most updates occurring in real time. Requests are answered within seconds — everything from finding the ruling local political parties by year to providing interactive maps of congressional roll calls dating back to 1789.
“It’s literally an open-source project,” Lewis says. “We don’t hold back any of the data. None of it is proprietary. It's a public good that we provide to the community that UCLA supports.”
We’ll vote for that.
Read more from UCLA Magazine’s Winter 2026 issue.